Load & Results Monitoring on dashboard
What I am big on is going through what my athlete’s have done (regarding the weights they have lifted) and see if they are following basic progressive overload.
Currently the only way to do this (that I have found) is to go into each individual athlete's profile and look into their strength.
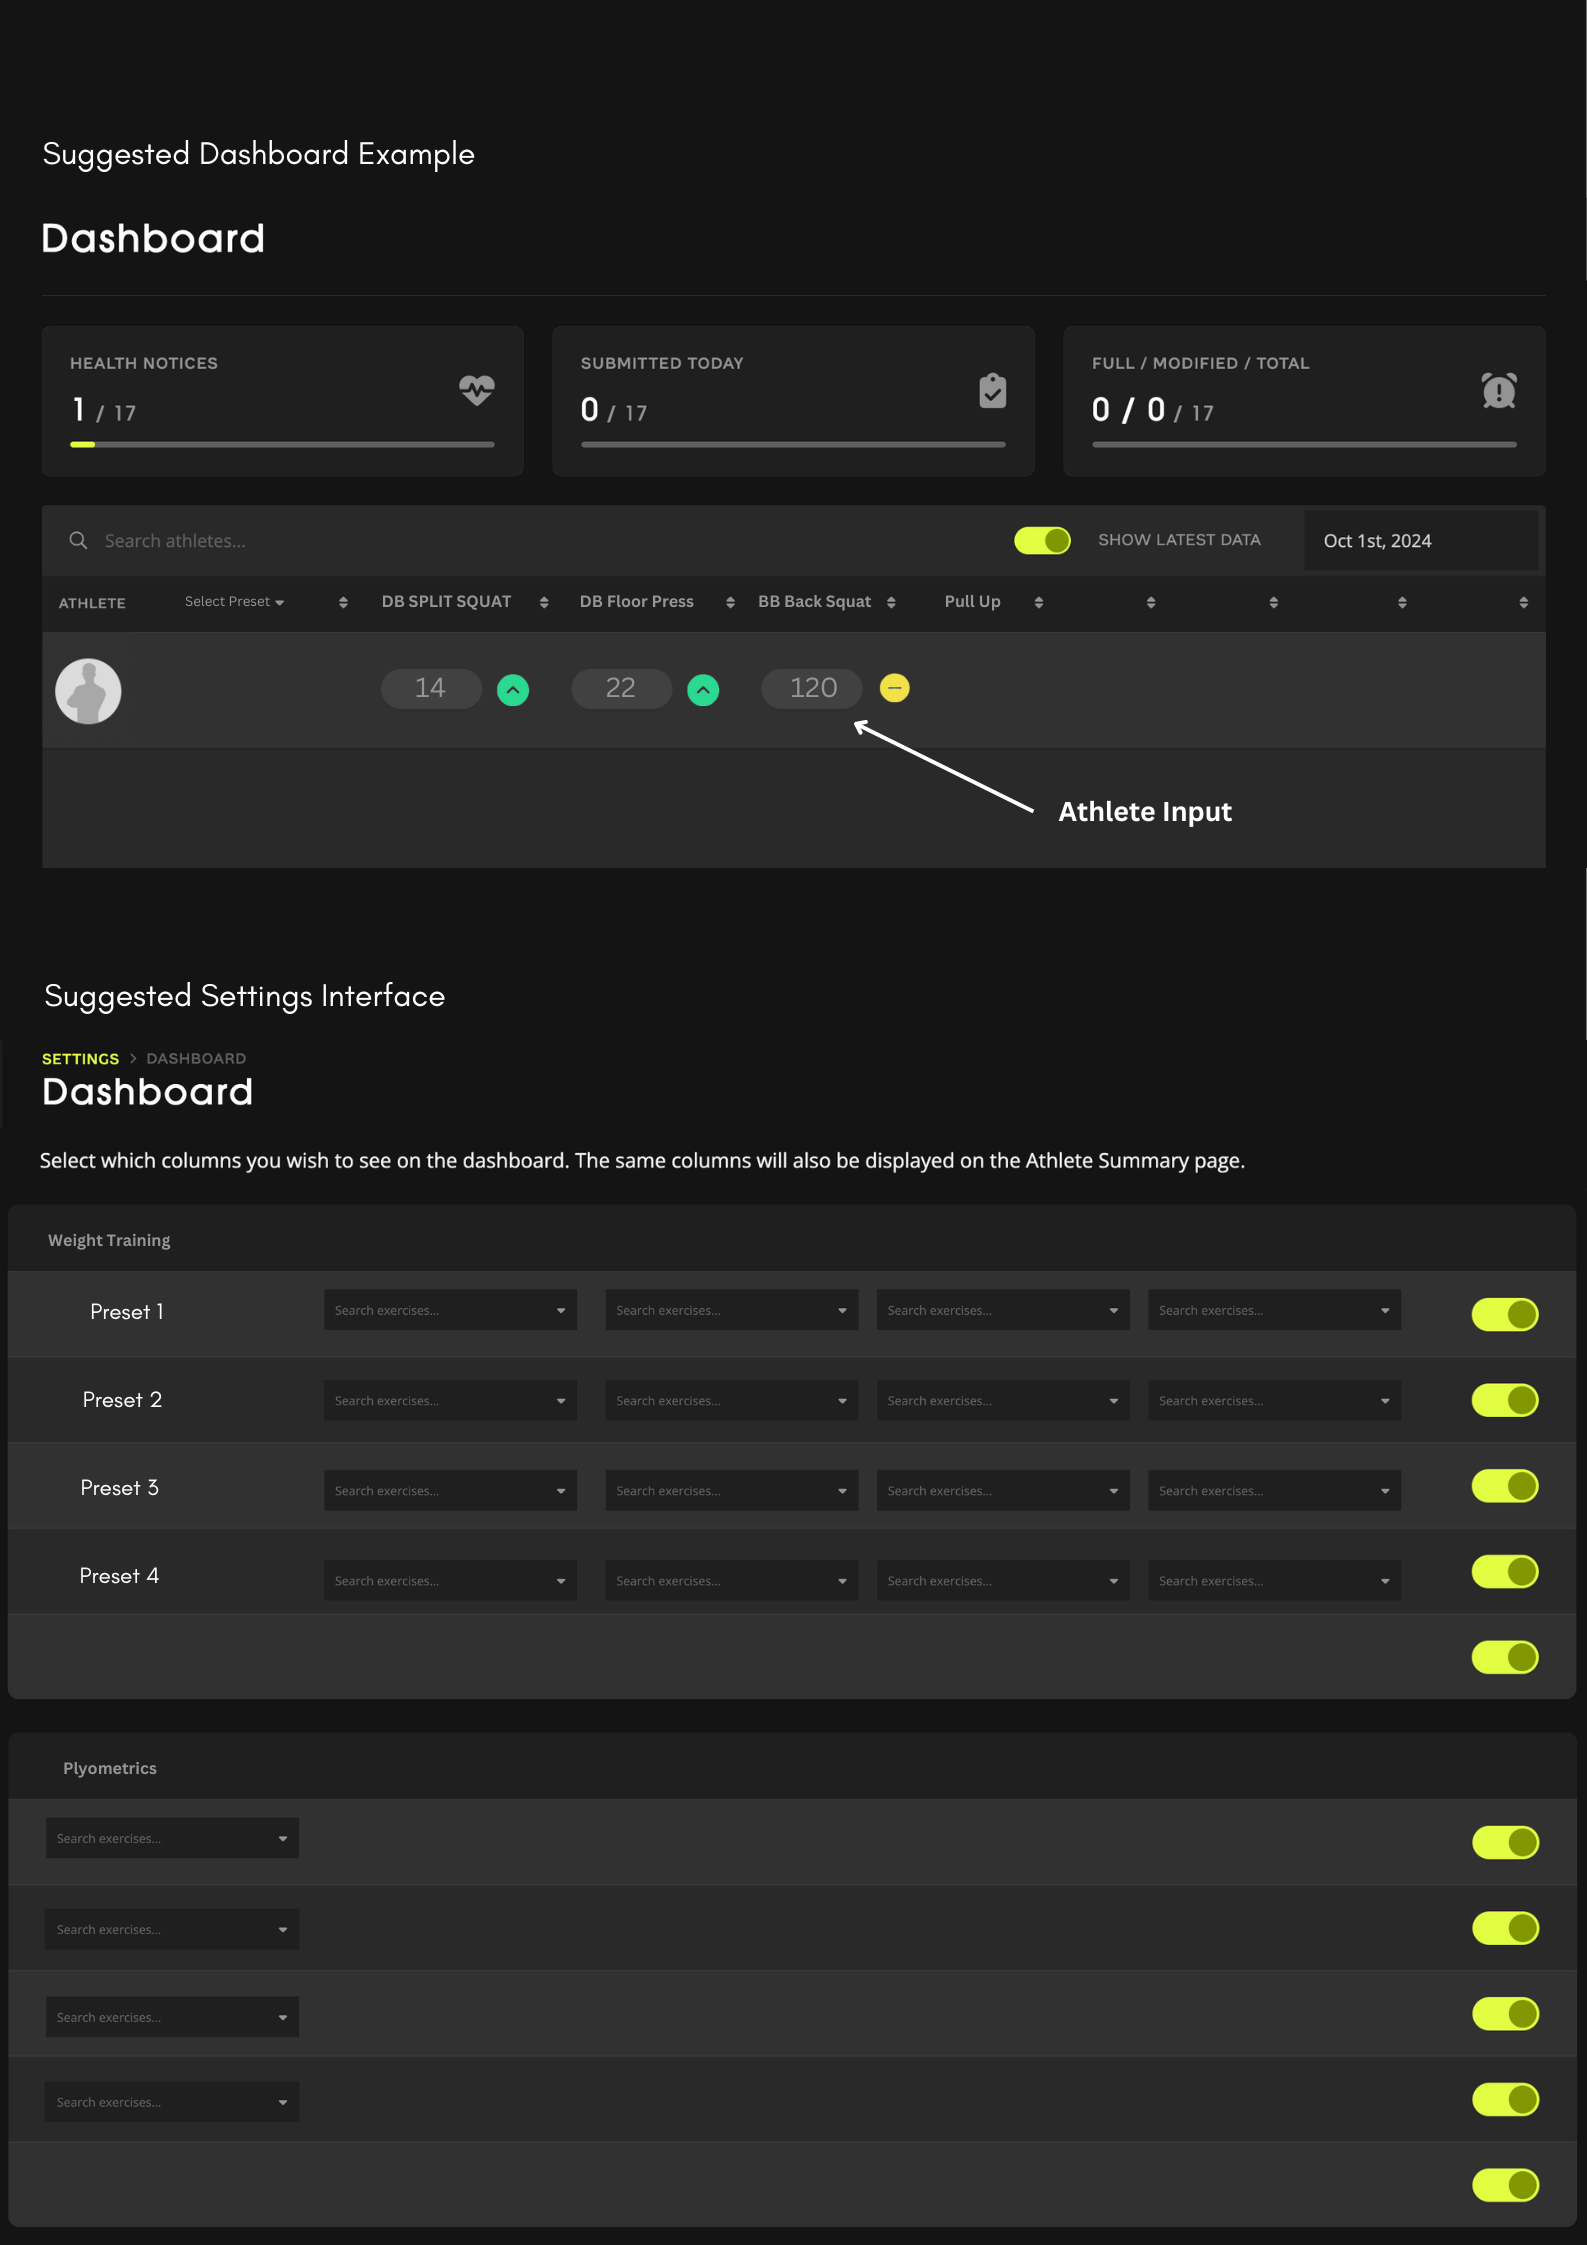
We have built a visual and was wondering if something like this could be implemented. It would use the customization of the dashboard to display exercises that you wanted to see and their latest inputs from the athletes. Next to the weight there would either be a red, amber or green symbol to show if in their latest input, they lifted more, the same or less than the previous input for that exercise.
These could be then put into a preset made in the dashboard settings and selected through the dashboard if you know you are looking at the same exercises for a certain block.
We then thought something similar could be done for inputting testing measures into Lumin. Where the metric that was inputted, either height or distance for example was displayed and the symbol next to the score would show an improvement, regression or plateau.
Log in to comment and vote
Comments2
Sep 15
PinnedSorry for the wait - this is finally done! Let us know if there are any other metrics/aggregations or other variations you would like to see!
Ryan Brereton
Oct 3, 2024
Wow, love and appreciate the detail here! This is all very likely to happen. We have a few things to finish off with the functionality of Lumin Strength, and then we will be shifting our focus heavily towards the Strength data visualisation. Thank you so much for explaining your use-case, it helps a great deal :-)